In 2017, the Tax Cuts and Jobs Act, passed by Congress and signed into law by then-President Trump, paused access to the moving tax expense deduction for non-military moves through the end of 2025. WERC, in conjunction with coalition partners from across the industry, have started advocating for the reinstatement of the deduction. As part of this effort, WERC reached out to its relocation management company (RMC) members for data to help inform its advocacy work.
RMC members were asked to weigh in with aggregate data in several areas covering moves from 2016 to 2023*, including total relocations managed (U.S. and international), average percent of new hire moves versus current employee moves (U.S. domestic only), and top locations for moves in the domestic U.S.
What follows are high-level findings from WERC’s RMC members that responded to the survey.
1. Total Relocations Show a Stable, Largely Upward, Trend
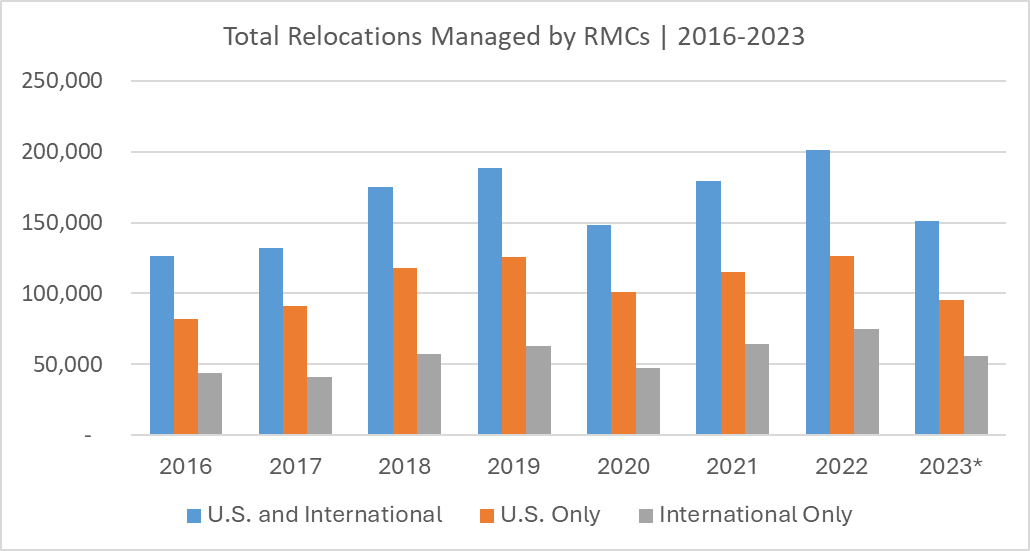
Respondents were asked to share the number of relocations managed, broken down by total assignments (i.e., U.S. domestic and international) and U.S. domestic only. Following the overall trend line, total relocations managed grew, with expected dips in the early pandemic years—though no year from 2020 onward ever went below the number of moves in 2016.
Over the course of seven years, the proportion of U.S. domestic relocations managed by surveyed RMCs varied by only six percentage points. A high of 69% was tallied in 2017, out of a total of 132,076 total relocations, while a low of 63% was tallied in both 2022 and 2023*, from a total of 201,373 and 151,027 total relocations, respectively. The year 2022 also saw the highest number of total relocations, while 2016 saw a low of 126,176.

2. A Close Balance Between New Hire vs. Current Employee Moves
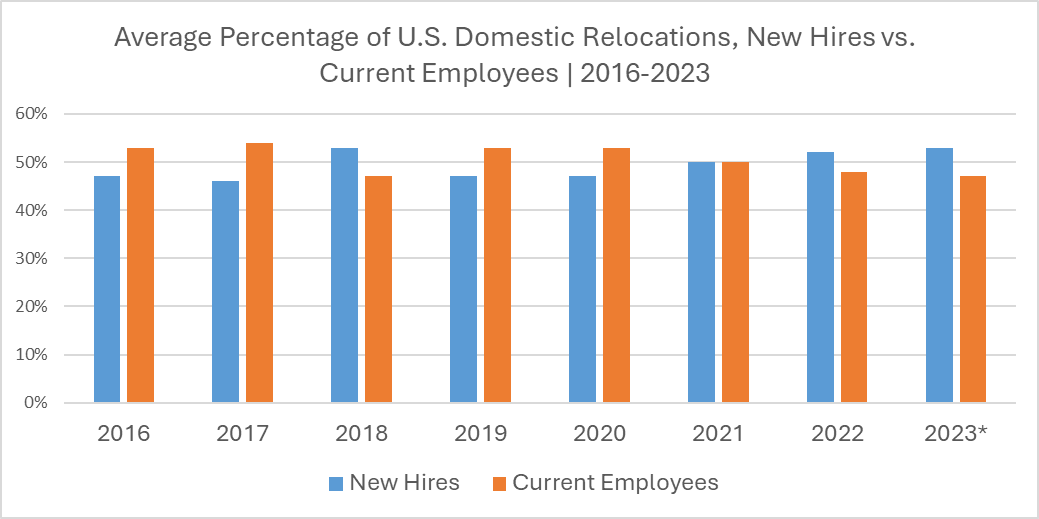
When breaking down the percentage of new hires compared to current employees in U.S. domestic relocations, we see some interesting fluctuations. In three of the years (2018, 2022, and 2023), the percentage of new hires exceeded the percentage of current employees, while in 2016, 2017, 2019, and 2020, the reverse was true. (The year 2021 saw a 50-50 breakdown). Never, however, did the differences exceed eight percentage points, and that maximum was reached in just one year: 2017.

3. Texas, California, and Florida Remain Top U.S. Destinations
Respondents were also asked to provide annual information on the states or territories that were the most common destinations for U.S. domestic relocations managed by their company. They were each asked to select up to 10 locations, again with data spanning from 2016 to 2023.
Texas topped the list, or was tied at the top, in each but one year (2020), when California was listed by the most companies. Florida came in at No. 2 or No. 3 on all lists. These three states together rounded out the top three each year, except 2016, when North Carolina came in at No. 3 (Florida was ranked fourth that year). New York was listed within the top five each year.
WERC continues to monitor activity and trends related to the Moving Tax Expense Deduction and other provisions associated with the Tax Cuts and Jobs Act of 2017. If you would like to weigh in with your experience and/or perspectives around the moving tax expense deduction, relocation trends in the U.S. or worldwide, or on any other topic top-of-mind for you and your organization, contact Mike Jackson at WERC to share your insights directly, or consider sharing your perspective with the broader industry via a member-submitted thought-leadership piece.
*Year-to-date through 30 September 2023